We’re going to try to keep you up-to-date on analysis of the midterms. Usually, that will mean giving you stories from several sites, so you get a balanced view. This time, however, we want to focus on FiveThirtyEight. The site averages polling better than anyone, but they also analyze what the polling seems to mean. This week, they gave us three stories on the election: “tipping-point” states, the takeaways from their forecast, and several charts to back up their analyses.
Since we all like instant gratification, let’s begin with their five “takeaways.” They note that their forecasts are tempered: “the range of possible outcomes is wide and Democrats’ prospects are far from certain. Relatively small shifts could allow Republicans to keep control of the House, or could turn a blue wave into a tsunami.” The bottom line is that Democrats are expected to get 7 to 8% more popular vote, but as we’ve seen, that doesn’t necessarily mean winning.
Theme No. 1: A broad consensus of indicators point toward Democrats performing well
• The Lite version of our forecast, which focuses as much as possible on district-level and generic ballot polls, projects Democrats to win the popular vote for the House by 7 or 8 percentage points.
• The Classic version of the model, which incorporates a lot of non-polling metrics such as fundraising and past voting in each district, also shows Democrats winning the popular vote by 7 or 8 points.
• The generic ballot, which influences all three versions of our forecast, has generally shown Democrats with a lead of … 7 to 8 percentage points.
• And finally, our model calculates a starting assumption about the race based on historical trends in midterms since 1946 and presidential approval ratings. It also implies that Democrats “should” win the House popular vote by about 8 percentage points — just what the other metrics show.
Theme No. 2: However, there’s some feast-or-famine risk for Democrats
We have only 215 seats rated as favoring Democrats — “lean Democrat” or stronger — which is fewer than the 218 they need to take the House. Nonetheless, Democrats are favored to win the majority if current conditions hold because they’ll have a bunch of opportunities, even as underdogs, to win those extra seats: 14 toss-up races, 19 “lean Republican” races and 53 “likely Republican” contests.
Theme No. 3: Incumbents — especially Republican incumbents — are really vulnerable
Our forecast also shows a relatively narrow advantage for Democratic incumbents. But Democratic incumbents have little exposure in the House: Any Democratic representative who was strong enough to survive the GOP waves in both 2010 and 2014 probably won’t have any problems this year. (It’s a entirely different story in the Senate, where there are lots of vulnerable Democratic incumbents who were last re-elected in the strong Democratic year of 2012.)
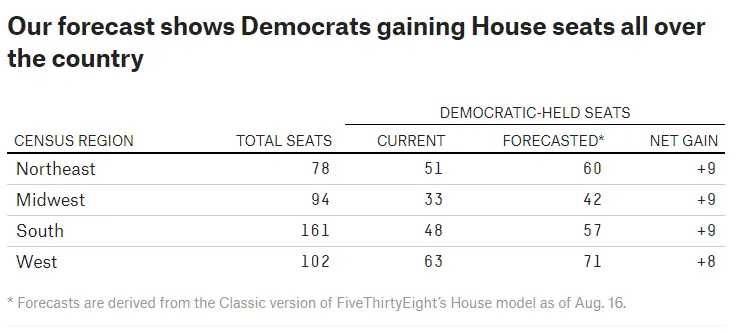
Theme No. 4: Potential Democratic gains are broad-based, across all regions of the country
Republicans are facing a multi-front assault in the House this year:
• In the Northeast, they have a lot of exposure in New York and New Jersey, which were once bastions of moderate Republicanism but which have become increasingly inhospitable to this brand of politics — and in Pennsylvania, where court-ordered redistricting resulted in a bad map for Republicans and where a lot of GOP incumbents have retired.
• In the South, they face pressure because of demographic change in states such as Georgia and Virginia — and increasingly in Texas.
• In the Midwest, there’s the risk of reversion to the mean with Trump off the ballot, especially as the GOP coalition in these states has come to rely on voters without a college degree who don’t always participate in midterm elections.
• And in the West, there are 14 Republican-controlled seats in California and another four in Washington that look increasingly out of place as the Pacific Coast becomes a somewhat literal “blue wall.” . . .
Theme No. 5: Democrats need to win the popular vote by a fairly wide margin
The Classic version of our model gives Democrats a near certainty (about a 98 percent chance) of winning more votes than the GOP in the race for the House — but “only” a 3 in 4 chance of winning the majority of seats. This discrepancy between votes and seats reflects a combination of gerrymandering, voter self-sorting1 and incumbency, all of which favor Republicans to some degree. Thus, in the Classic version of our forecast, Democrats would need to win the popular vote by about 5 percentage points in order to become favorites to win the majority of seats in the House.
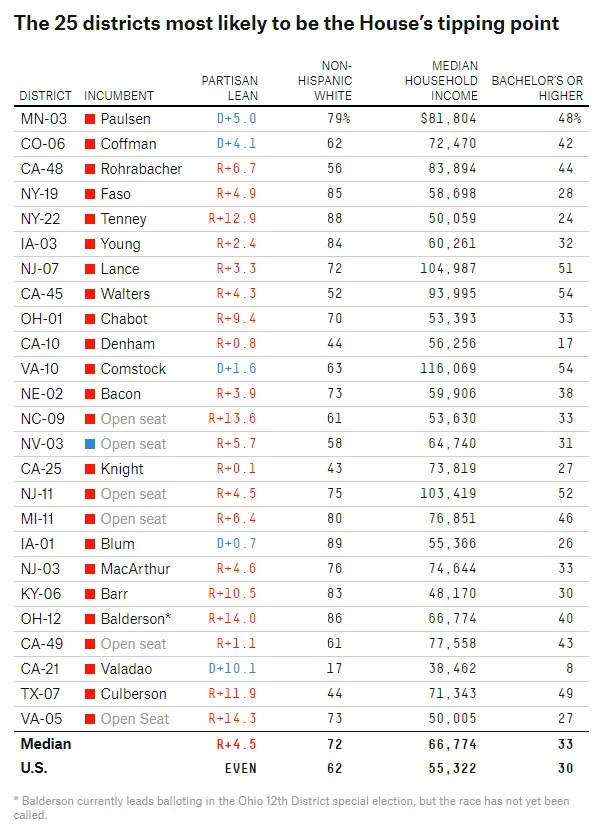
This synopsis was devolved from their “tipping point” article, in which they pointed out that, yes, there are a number of swing states, but the real outcome always comes down to just one state, and maybe even one district. For instance, in 2016, Wisconsin elected Donald Trump. This year, to paraphrase the old saying, “as Minnesota’s 3rd District goes, so goes the country.” BUT, it could be one of any of 25 districts.
The 25 districts most likely to be the House’s tipping point, listing political leaning, percentage that is non-Hispanic white, median household income, and percentage who hold bachelor’s degree or higher
That chart is not very encouraging for Democrats. While Republicans have more seats to defend, most are incumbents—with partisan lean of up to 14% or more.
If you want to see more charts, check the FiveThirtyEight page for forecasting the 2018 midterms.
That page says, despite all the variables, Democrats have a 3-1 probability to take the House, according to technical analysis. Every district in the country is described in a great interactive chart. There are also historical charts. Geek out to your heart’s content.
Donate Now to Support Election Central
- Help defend independent journalism
- Directly support this website and our efforts


